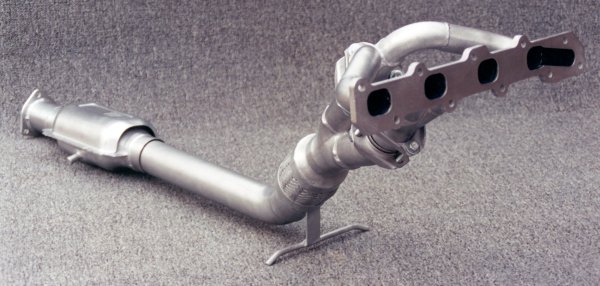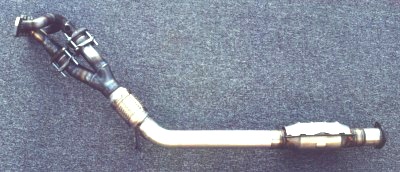

Iperformance; Dyno Testing and Comparison of Exhaust Headers for 1996-2002
Chevrolet Cavalier Z24 and Pontiac Sunfire GT
Independent Testing
We were recently contacted by Mike Raque, the owner of a 1996 Pontiac Sunfire GT, who had purchased an Iperformance header for his Quad Four engine to replace a RK Sport header. Mike explained that he had the car dyno tested at The Dyno Shop in Louisville, Kentucky, on their DynoJet dynamometer, with the RK Sport header on October 26, 2001 and then again at the same facility on February 16, 2002, with the Iperformance header. Mike was nice enough to make copies of the dyno tests available to us.
The dyno results were provided in the form of three different charts. The first was a horsepower chart from the October 26, 2001 dyno session reading from 3,000 RPM through 5,600 RPM horizontally and 0 through 150 HP vertically. The second chart was a torque chart from the October 26, 2001 dyno session reading from 3,000 RPM through 5,600 RPM horizontally and 0 through 175 ft-lb vertically. The third chart was the combined horsepower and torque charts from the February 16, 2002 dyno session reading from 2,800 RPM through 5,600 RPM horizontally and 0 through 175 HP and ft-lb vertically.
Mike commented that he was extremely happy with the build quality, ease of installation, and the "seat of the pants" improvement in performance that the Iperformance Header provided when compared to the RK Sport header, but that he was not as impressed with what he saw when he looked at the dyno charts, specifically the peak horsepower measurement printed on each of the charts. The October 26, 2001 test of the RK Sport header was indicated as producing a peak horsepower of 135.6 HP, while the February 16, 2002 test of the Iperformance header was indicated as producing a peak horsepower of 136.4 HP. A one horsepower difference.
Mike commented that he knew the car felt like it had gained more than one horsepower and was more than a little concerned that the performance improvement he felt was not confirmed by the peak horsepower as printed on the dyno charts.
Reading the Information
We took a look at the charts and immediately noticed several things. First, that each of the three charts was in a different scale (as described above in the layout of the charts horizontally and vertically, starting and ending at different measurements). The appearance of the information on the charts is deceptively similar, and considering the scale of the horsepower and torque information on the chart would indicate a 6 HP or ft-lb difference in measurement over a 1/8 inch change in position on the chart, it quickly became apparent that it would be impossible to make any valid comparison of the information on three different charts set to three different scales.
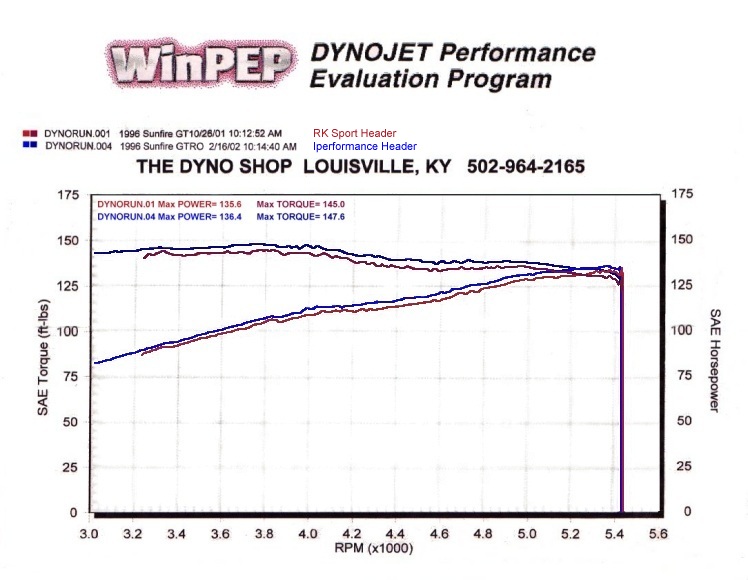
So, we had the information of the three charts scaled to match and put the horsepower and torque curves for both the October 26, 2001 and February 16, 2002 tests on a single chart so that it could be easily and accurately compared.
Once this was accomplished, a valid comparison of the results became obvious, and what had been believed to be the "same curves" were found to be quite different. In fact, the results from the two dyno sessions showed a difference of two to four horsepower and four or five foot pounds of torque across most, if not all of the chart.
Spikes and Speed Limiters
One mystery did still remain. Why does the October 26, 2001 test results show a peak horsepower of 135.6 HP while the February 16, 2002 test results show a peak horsepower of 136.4 HP?
Understanding this takes a very close look at the far end of the horsepower curve and an understanding of how dyno testing is done as well as how the Cavalier and Sunfire engine control system and how it limits testing on a dynamometer.
As described in our other dyno test writeups, dyno testing is done by first parking the vehicle drive wheels on the rollers of the dynamometer, strapping it down to the ground, and placing an inductive pickup on the number one ignition wire (or trigger wire for the number one spark plug for vehicles such as this with direct fire ignition systems). The vehicle is then accelerated through first, second, and third gears into fourth gear, which is used for the testing because fourth gear is typically the closest to a 1:1 drive ratio. The operator holds the engine speed somewhere just above 2,000 RPM, engages the dynamometer, and then accelerates in fourth gear up to and just short of the maximum engine speed or redline.
For most vehicles, this is rather straight forward, but the Chevrolet Cavalier and Pontiac Sunfire have a safety mechanism called a speed limiter, that is built into the computer control system which cuts off the ignition system when the vehicle reaches a speed of 105-108 MPH. This speed is easily reached by these vehicles in fourth gear, and the vehicle will jolt rather noticeably when the speed limiter kicks in.
When this happens while a vehicle is being tested on a dynamometer, the action of the engine cutting off while the tires are spinning at 108 MPH will result in the dyno rollers suddenly decelerating for a split second, until the inertia of the rollers overcomes the engine, and the rollers will accelerate again to a speed slightly less than before the speed limiter engaged.
This sudden deceleration followed by the feedback of the rollers overcoming that deceleration results in a sharp and artificial peak at the very end of the curves of both the horsepower and torque measurements.
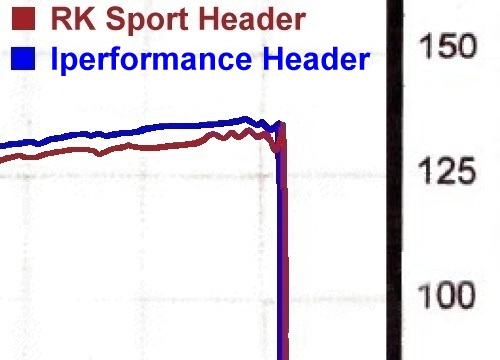
This artificial peak can be seen at the very end of the curve just before the line drops vertically to zero when the operator concludes the test.
If the speed limiter engaged at a point after the engine power curve was already trailing off, this little artificial peak would not cause much distraction, but, because the speed limiter on these vehicles engages while the power curve is still climbing, just prior to actual peak horsepower, the little artificial spike is picked up as the maximum horsepower measurement, and while the October 26, 2001 test results showed the power curve peaking just above 134 HP at a little below 5,400 RPM, trailing down to about 130 HP after the speed limiter starts to engage, and then jumping 5 horsepower due to the feedback of the rollers rapidly decelerating and accelerating, and displaying the resulting artificial spike that is unfortunately and inaccurately picked up as the maximum horsepower measurement, which the DynoJet software prints on the corner of the chart as 135.6 HP.
This is why it is important for the dyno operator to determine what engine speed the speed limiter will engage at and set the dynamometer to conclude the test just before that speed limiter engages, to avoid this inaccuracy.
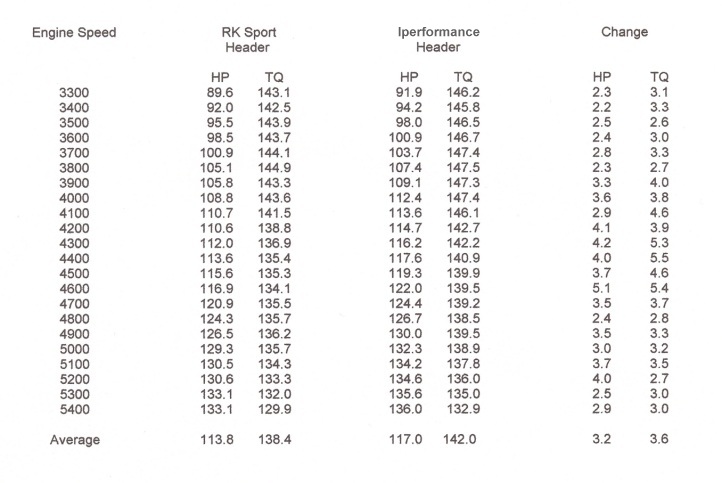
Dyno Chart Showing Performance Of Both The RK Sport Header and the Iperformance HeaderClick on The Charts to See a Larger Image...
So What Is The Performance Difference?
We would have liked to have seen a dyno run of the performance of the stock manifold and down pipe, but Mike did not have the car tested before he put the RK Sport header on, so analysis is confined to a comparison of the performance of one header to the performance of the other header.
The RK Sport Header
After correcting for the false peak of running the car off the speed limiter, the RK Sport returned a peak horsepower of 134.4 HP at 5,377 RPM. The peak torque was 145.0 ft-lb.
Over the tested range from 3,300 RPM to 5,400 RPM, the RK Sport header averaged 113.8 HP and 138.4 ft/lb of torque.
The Iperformance Header
The Iperformance header returned a peak horsepower of 136.4 HP and a peak torque of 147.6 ft-lb.
Over the tested range from 3,300 RPM to 5,400 RPM, the Iperformance header averaged 117.0 HP and 142.0 ft-lb of torque.
The Difference Between The Two
The Iperformance header measured a peak horsepower gain of 2.0 HP and a peak torque gain of 2.6 ft-lb over the RK Sport header.
The Iperformance header measured an increase of average horsepower of 3.2 HP and an increase of average torque of 3.6 ft-lb over the RK Sport header.
Looking at the annotated power numbers at each 100 RPM increment, the Iperformance header picked up a peak gain of 5.1 HP at 4,600 RPM and 5.5 ft-lb of torque at 4,400 RPM over the RK Sport header.
Further study of the annotated chart reveals that the Iperformance header shows the most improvement over the RK Sport header through a broad section of the middle of the power curve, roughly from 3,900 RPM through 5,200 RPM, where it picks up 3.5 or more HP and 3.5 ft-lb of torque at almost every single 100 RPM sampling. This can be attributed to the Tri-Y design of the Iperformance header, which produces a performance increase over a wider range than the 4-1 design of the RK Sport header. 4-1 headers tend to produce performance increases over a narrower band.
Conclusion
One conclusion seems very clear, that it is very important to get all of the information and data being compared in the same scale and onto a single chart so that it can be compared accurately.
Mike's "seat of the pants" assessment of the performance change was more accurate than he believed, and that increase in performance with changing from the RK Sport header to the Iperformance header is very easy to see in the dyno testing results, when those results are presented with both sets of horsepower and torque curves on one chart.
The Iperformance header shows peak gains of 5.1 HP at 4,600 RPM and 5.5 ft-lb of torque at 4,400 RPM over the RK Sport header. It is pretty obvious to see that there is a rather serious difference between the performance of the two products. How much of a difference is this in terms of what the driver will feel? Consider this, the difference in power between the Iperformance header and the RK Sport header is comparable to the difference in power between a stock exhaust system and a performance cat back exhaust system. This is a rather noticeable difference, and represents a serious power advantage for those who are serious about performance.
Mike informed us that he is more than happy to answer questions about his car and the testing and can be contacted by email at:
EMAIL: rksport_96@yahoo.com
We would like to thank Mike for providing his dyno results to us.
The Dynojet Shop that Mike Raque used for his testing can be contacted in Louisville at:The Dyno Shop
7801 Carol Ave.
Louisville, KY 40219
TEL: (502) 964-2165


